Pivot Transform
With Pivot, unique values from one column become headers in a wider table, while another column provides the values beneath them.
Basic Usage
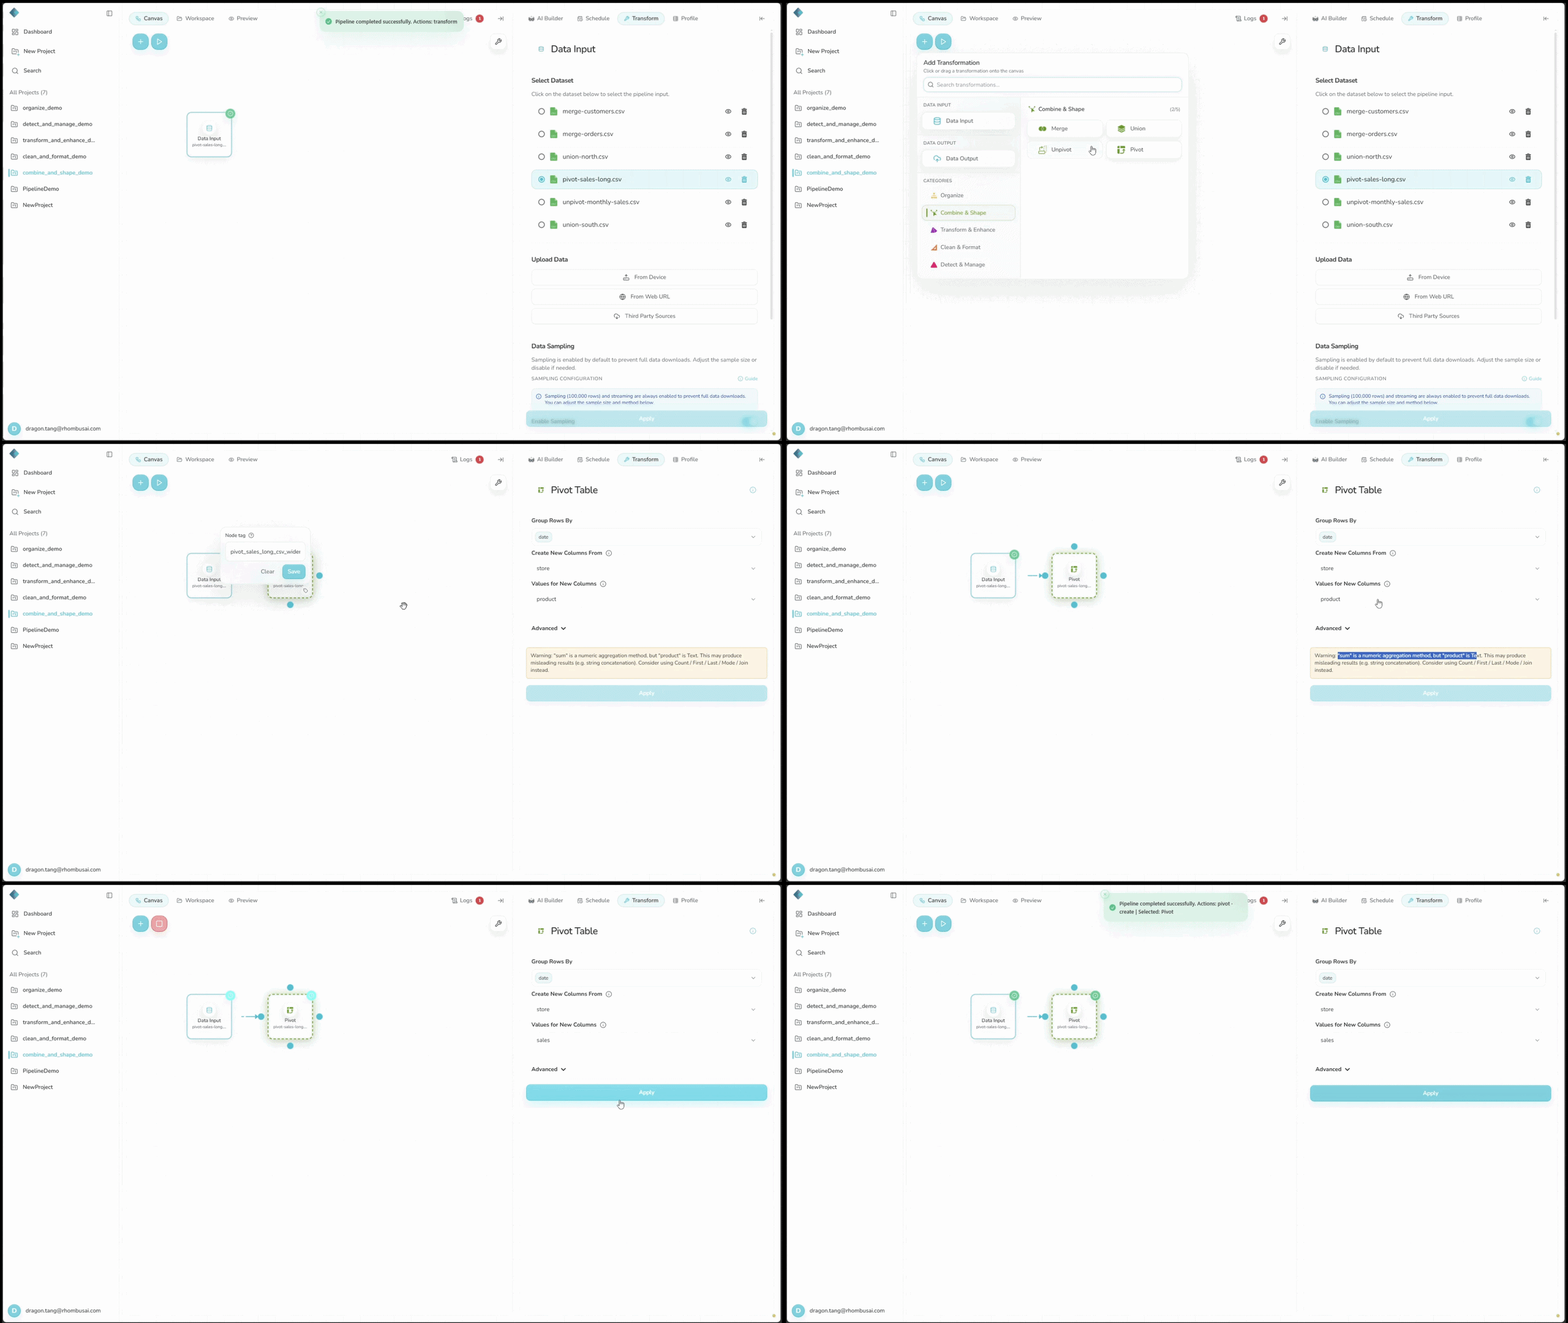
To build a pivoted table:
- Select Pivot from the transform menu.
- Choose the columns that group the output rows.
- Select the column whose values should become new headers.
- Select the column that supplies the pivoted values.
- Choose an Aggregation Method and, if needed, a Fill Value.
Configuration Options
Basic Options
- Group Rows By: Select one or more columns that identify an output row.
- Create New Columns From: Select the column whose unique values will become headers.
- Values for New Columns: Select the column that will fill the pivoted cells.
Advanced Options
-
Aggregation Method: Choose how to combine multiple values that land in the same pivoted cell:
- Mean
- Sum
- Count
- First
- Last
- Min
- Max
Sum, Mean, Min, and Max require a numeric Values for New Columns column. If you use one of them with a text column, Rhombus displays a warning and disables Apply.
For text values, choose Count, First, or Last. Use First when the pivoted cells should contain text instead of a count.
- Fill Value: Enter the value to place in empty pivot cells.
Limits and Processing Time
- Pivot columns: Create New Columns From can contain no more than 1,000 unique, non-null values.
- Estimated pivot cells: The number of unique, non-null Create New Columns From values multiplied by the number of unique Group Rows By combinations cannot exceed 5,000,000.
- Runtime threshold: Based on the estimated cell count, the backend sets a threshold between 10 and 120 seconds. Exceeding it produces a timeout error, but does not forcibly stop the worker thread. The request may still wait for the pivot to finish before returning the error.
Examples
Example 1: Basic Pivot
Input Dataset:
| Date | Store | Product | Sales |
|---|---|---|---|
| 2024-09-01 | Store A | Product 1 | 100 |
| 2024-09-01 | Store A | Product 2 | 150 |
| 2024-09-02 | Store B | Product 1 | 90 |
| 2024-09-02 | Store B | Product 2 | 130 |
Configuration:
- Group Rows By:
Store - Create New Columns From:
Product - Values for New Columns:
Sales - Aggregation Method:
Sum - Fill Value:
0
Result:
| Store | Product 1 | Product 2 |
|---|---|---|
| Store A | 100 | 150 |
| Store B | 90 | 130 |
Example 2: Multi-Index Pivot
Input Dataset:
| Date | Store | Product | Sales |
|---|---|---|---|
| 2024-09-01 | Store A | Product 1 | 100 |
| 2024-09-01 | Store A | Product 2 | 150 |
| 2024-09-02 | Store B | Product 1 | 90 |
| 2024-09-02 | Store B | Product 2 | 130 |
| 2024-09-03 | Store A | Product 1 | 120 |
Configuration:
- Group Rows By:
Date,Store - Create New Columns From:
Product - Values for New Columns:
Sales - Aggregation Method:
Sum - Fill Value:
0
Result:
| Date | Store | Product 1 | Product 2 |
|---|---|---|---|
| 2024-09-01 | Store A | 100 | 150 |
| 2024-09-02 | Store B | 90 | 130 |
| 2024-09-03 | Store A | 120 | 0 |
When several rows map to the same pivot cell, use an aggregation method that makes sense for the value column.
A pivot can create many columns. Filter or group high-cardinality values first to stay within the limits and keep the output readable.
Best Practices
- Choose Group Rows By columns that clearly identify each output row.
- Use Sum, Mean, Min, or Max for numeric values. Count, First, and Last also work for non-numeric values; First is usually the clearest option for text.
- Pick a deliberate Fill Value, such as
0for numbers orUnknownfor categories. - Preview the output, especially when Create New Columns From has many unique values.