Detect Outliers Transform
The Detect Outliers transform marks unusual numerical values in the output mask without changing the values themselves.
Basic Usage
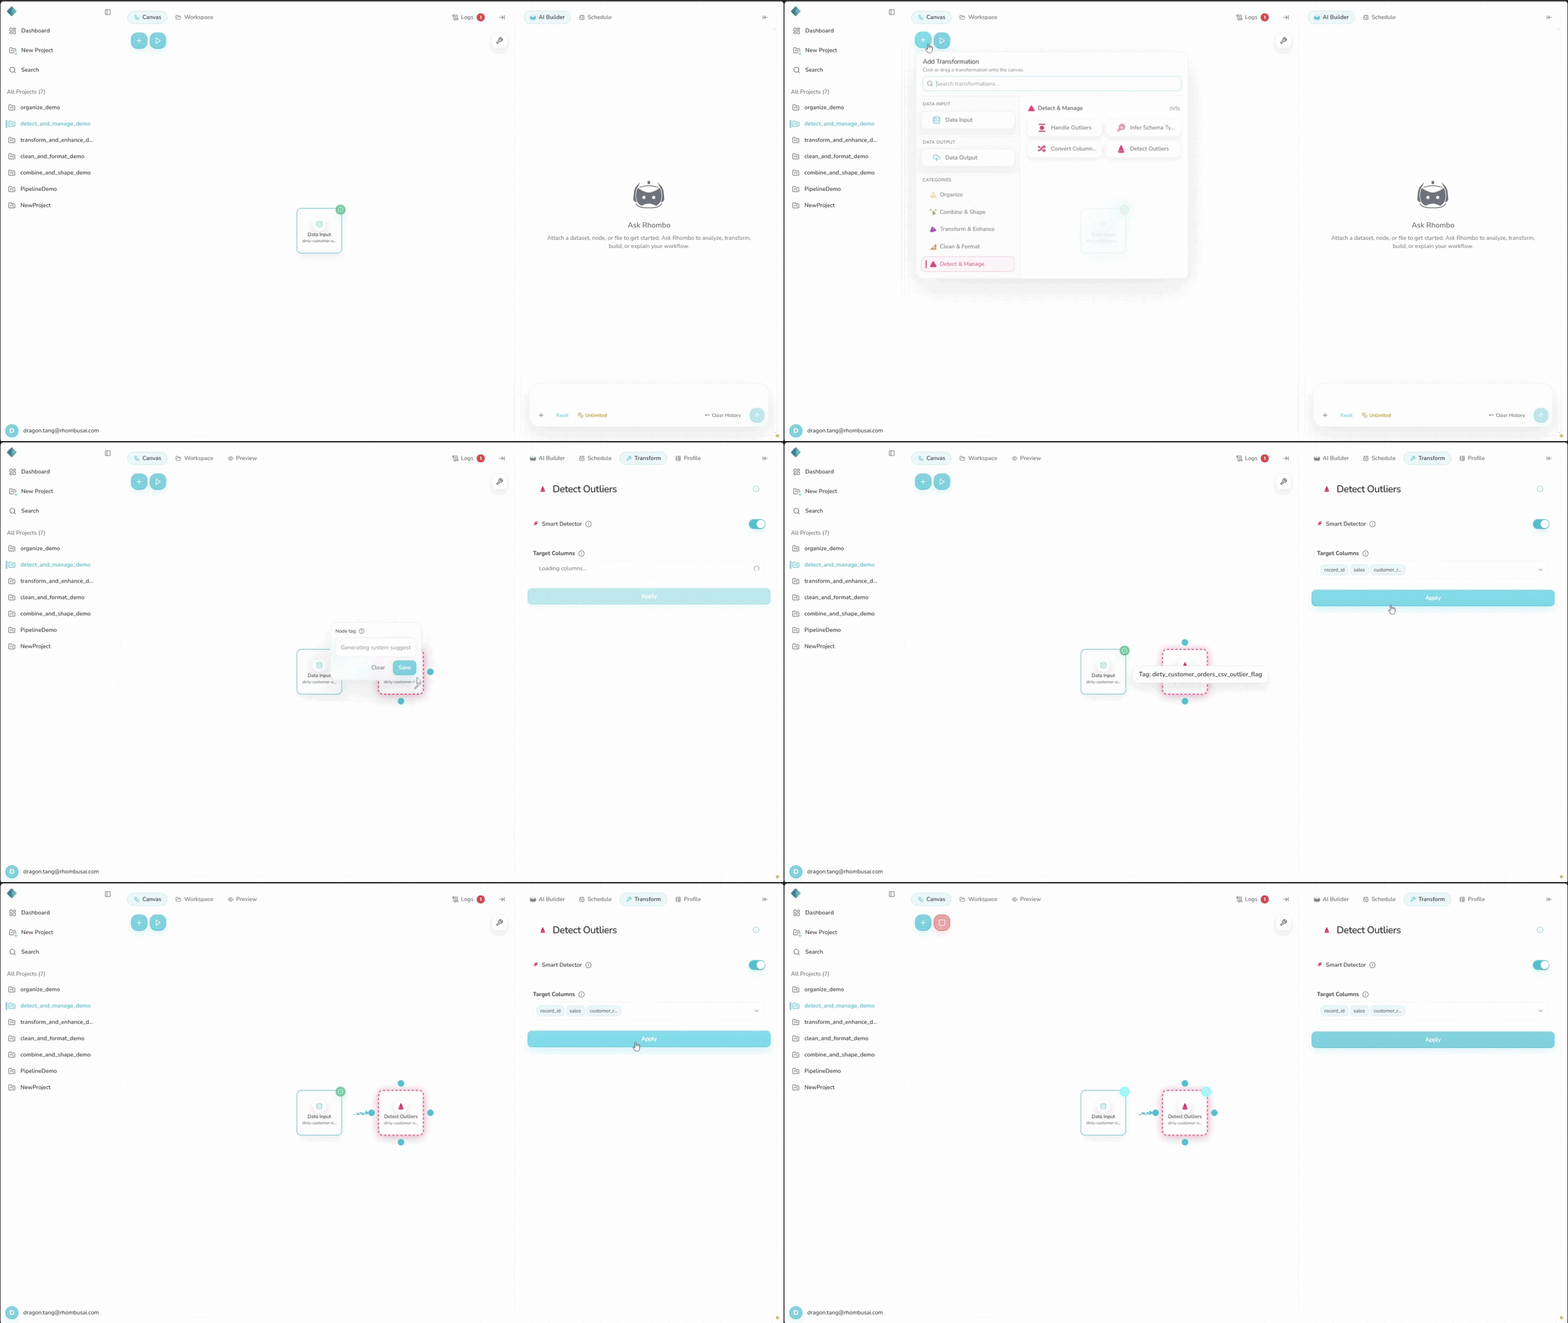
To mark outliers:
- Select the Detect Outliers transform from the transform menu.
- Select at least one numerical column under Target Columns.
- Leave Smart Detector on to choose and combine methods automatically. Turn it off to choose a detector yourself.
- Configure any settings shown for the manual detector.
- Apply the transformation.
Detect Outliers works only with numerical data. Target Columns therefore lists only numerical columns.
Configuration Options
Target Columns
Select one or more numerical columns. The same selection is used in Smart and manual modes.
Smart Detector
Smart Detector is on by default. It groups related target columns and ranks up to three methods based on their distributions. Within each group, it marks only values found by every selected method. Smart Detector is a mode, not an item in the manual Detector list.
Manual Detector
Turn off Smart Detector to use one detector for every target column:
- Z-Score
- Tukey's Fences
- Standard Deviation
- Percentile
- Isolation Forest
- Local Outlier Factor (LOF)
Select the information icon beside Detector to open the method guide.
Advanced Options
Each manual method provides its own settings:
Z-Score
- Threshold: The absolute Z-score a value must exceed. The default is
2; a score of exactly2is not an outlier.
Tukey's Fences
- Multiplier: Multiplier applied to the Interquartile Range (IQR). Defaults to
1.5.
Standard Deviation
- Threshold: Number of standard deviations from the mean a value must exceed. Defaults to
2.
Percentile
- Lower Percentile: Marks values below this percentile. Defaults to
5. - Upper Percentile: Marks values above this percentile. Defaults to
95.
Isolation Forest
- Contamination: Expected share of outliers. Defaults to
auto.
Local Outlier Factor (LOF)
- Number of Neighbors: Number of neighbors used to estimate local density. Defaults to
20.
Requirements and Limits
- Each selected column must contain at least three non-null numerical values and at least three distinct numerical values.
- Isolation Forest and LOF do not accept missing values. Fill or remove them before using either method manually. Smart Detector may also select these methods for eligible data.
- Manual Isolation Forest and LOF reject inputs above
10,000rows or100,000total cells. The check covers the entire input, including unselected and non-numerical columns. Exactly10,000rows or100,000cells is allowed.
If one selected column fails these numerical requirements, the entire transform fails. It does not skip that column.
Detection Methods
Z-Score
Measures each value's distance from the mean in standard deviations.
Use for: Roughly normal data without extreme skew.
Tukey's Fences
Uses the Interquartile Range (IQR) to set lower and upper fences.
Use for: Data where the middle 50% is a useful measure of spread.
Standard Deviation
Marks values beyond the chosen number of standard deviations from the mean.
Use for: Roughly normal data when overall spread is meaningful.
Percentile
Marks values below and above chosen percentiles.
Use for: Fixed lower and upper tails of a distribution.
Isolation Forest
Isolates anomalies through random feature and split selection.
Use for: Rare anomalies in data with several numerical features.
Local Outlier Factor (LOF)
Compares each value's local density with its neighbors.
Use for: Data whose normal density varies across regions.
Examples
Example: Detecting Outliers in Sales Data
Input Dataset:
| Date | Product | Sales | Customer_Rating |
|---|---|---|---|
| 2023-01-01 | A | 100 | 4.5 |
| 2023-01-02 | B | 120 | 3.8 |
| 2023-01-03 | A | 1500 | 4.2 |
| 2023-01-04 | C | 80 | 4.2 |
| 2023-01-05 | B | 110 | 4.0 |
Configuration:
- Smart Detector: Off
- Target Columns:
Sales - Detector: Z-Score
- Threshold:
1.5
Result:
For Sales, the mean is 382 and the sample standard deviation is about 625.16. The value 1500 has a Z-score of about 1.79, which exceeds 1.5. No other value crosses the threshold.
The output mask is True for row 3's Sales value (1500) and False for the other Sales cells.
With a threshold of 3, this dataset would have no Z-score outliers because 1.79 does not exceed 3.
Best Practices
- Choose a detector that fits the distribution, and inspect a plot when possible.
- Treat a statistical outlier as a signal to review, not proof that the value is wrong.
- Compare methods when the result affects an important decision.
- Use domain knowledge before removing, capping, or keeping marked values.
Troubleshooting
- No outliers are found: Lower the detector's threshold if appropriate.
- A scale-sensitive method gives poor results: Normalize the data before using a method such as Z-Score.
- Too many values are marked: Check for skew and reconsider the detector.
- A target column is rejected: Confirm that it has at least three non-null and three distinct numerical values.
- Isolation Forest or LOF reports missing values: Fill or remove them, then try again.
- Isolation Forest or LOF reports that the dataset is too large: Choose another manual detector or reduce the input below the documented limits.